

Enviro Data Features
Water, soil, air, etc.
Field, lab, and operating data
Chemistry, geology, biology, engineering
Centralized data storage
Data integrity enforced
Sample planning, labels, COCs
Verification and validation
Tables, Graphs and maps
Reports and limits, statistics
Access front-end; Access or SQL back-end
Enviro Data Benefits
Save time and money
Improve project quality
Handle any size project
Get new clients
Keep regulators happy
Inexpensive to buy
Easy to learn and use
Best support in the industry
Runs in VM in the Cloud
Available in a web browser
The Leading Open Source Environmental Data Management Software
Enviro Data - Geotech's Enviro Data is a program for storing and displaying site environmental data. This powerful and intuitive software uses Microsoft Access for the user interface and Access, SQL Server or Oracle as a back-end database server. Enviro Data allows users to import analytical and other data from laboratory data files or printed reports, review the quality of the data, and then store the data in the database. The data storage structure (data model) has been carefully refined over many years based on our experience storing millions of records of environmental site data and satisfies the rules of Fifth Normal Form data structure.
Geotech's Enviro Data software has been used on a daily basis by many clients for over 30 years, storing hundreds of millions of records of data for thousands of projects. It stores and displays environmental quality data, such as field and laboratory data for water, soil and air. Users can cost-effectively import analytical and other data, review the quality, select data, and generate reports, graphs and maps, or provide data to other programs.
Your situation ... Site data drives your investigation and analysis process. Streamlining data flow into useful information saves time reaching a solution. Transforming site information into useful communication tools helps you and your clients see critical environmental issues and compliance remedies. Bringing closure to environmental issues quickly and cost effectively depends on how well you manage your data.
Our Solution ... We help you manage your project data from start to finish - more efficiently and cost effectively - with software that is easy to learn and use.
Going beyond the data ... We bring you the expertise and support to create a single-user or company-wide standard database that is central to all your site data workflow applications - from the field and lab to the regulators.

Menu-Driven Interface
Enviro Data's menus guide you through the functionality of the software, making it simple to use for people of all skill levels. From building your first database through routine data import and reporting, you can do what you need with just a few mouse clicks. For more complicated tasks, "wizards" take you step-by-step through the process, asking you for the necessary information, and helping you avoid common problems for that particular task. And Enviro Data comes with many values already set for you, so you can get useful results without having to worry about too many details, while allowing you to fine-tune most aspects of the program.
Display Options
One of the most powerful features of Enviro Data is the ability to customize the way your results are displayed to meet your project’s requirements. Many of the display option selections that you make can apply across various types of data, displays and exports. This lets you improve your data retrieval and display and displays the data that more consistently across diverse types of output. Multiple Display Option Sets can be saved for use with different viewing and reporting purposes.
The options you select are used to format your data as it is selected for use by the various export, reporting and other output options. If you use the selected data table for your own custom queries or reports, you get the benefit of the display option formatting in your custom retrievals.


Easy Data Selection
Enviro Data was built for users of all skill levels, and the data selection process reflects this. You can select data using a simple form-based query system, shown to the left, to see just the data you need. This system lets you select data from drop-down lists of station names (wells, borings, etc.), parameter names, etc., enter the dates and/or depths you are interested in, and then retrieve just the data you want to see, without getting involved in complicated SQL (structured query language) queries. (Or you can use SQL if you prefer.) After you have selected the data you want to work with, you can then create printed reports, graphs, or maps, save the data to disk, or copy it to the clipboard to paste into other programs. You can even make a subset of your database to transfer to other locations.
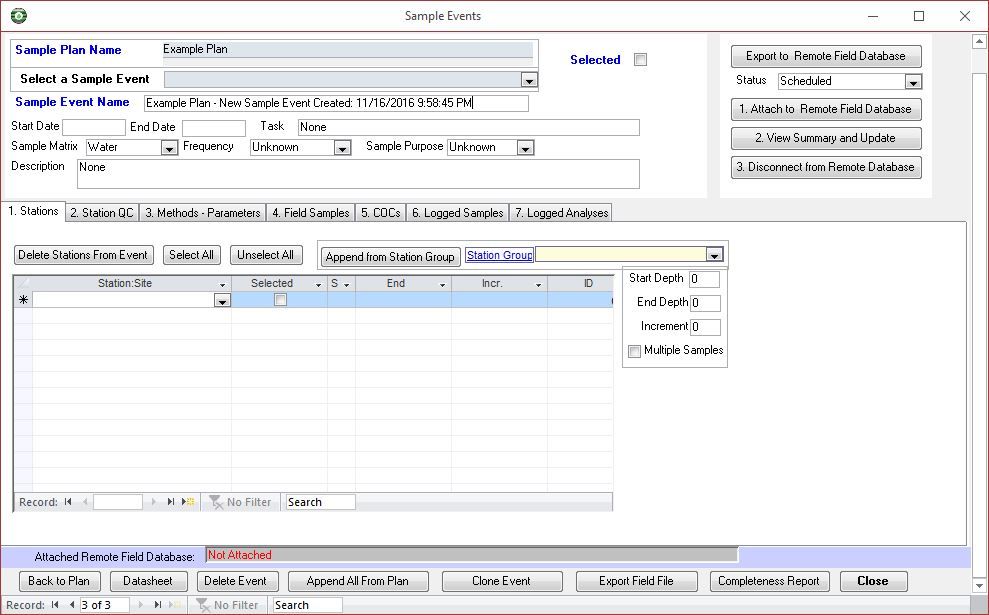
Sample Planning / Field Tool
Enviro Data's powerful Field Tool/Sample Event Planning feature lets you bring database power to planning and executing your field events. Start by specifying the locations and QC samples you will be gathering. Then select the parameters and methods for field and lab measurement and analysis. Print your container labels, chains of custody, and other field documents, directly from the database, either in the office or the field. Create a file to take to the field to enter that data on whatever device you have, and then easily import it. When the lab data comes in, import that, including blind samples and unsuccessful sample attempts. And at the end, run a completeness report to see what you actually received

Wizard-assisted Import
Import your data cleanly and quickly. Fill in missing data, enforce consistency, verify and validate as necessary, convert to standard units, and even be notified of exceedences right during the import! And really save time by having your labs check your data before they send it! Our reference file system closes the loop between labs and data users, requiring the labs to check data against updated lists of well names, parameter spellings, and other data elements prior to delivering the data. This wizard-assisted import and use of the reference files has reduced the time for importing and checking lab deliverables by a factor of six, saving hours and dollars.
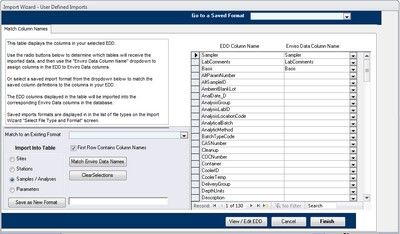
Flexible User-Defined Import
Enviro Data comes with several dozen pre-configured imports that will satisfy many of your needs. You can also easily define your own import formats. Arrange your data in an Excel file with one result in each row and one data element in each column. (It may be that way already.) Then use the Enviro Data Import Wizard to walk you through assigning each column in your Excel file to fields in Enviro Data. Then you can save the format with a name to use next time. You can even “uncrosstab” data in tables into Enviro Data’s tables, or import deliverables with multiple tables or sheets
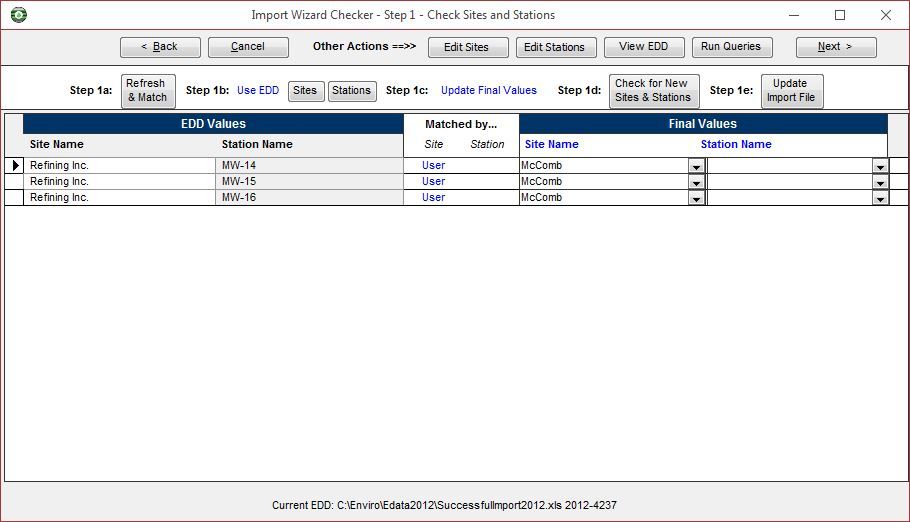
Advanced Data Checker
Now Enviro Data provides even more help when you need to import difficult files. This powerful tool, developed in cooperation with Enviro Data power users at Weston Solutions, lets you view your data at each data level - sites, stations, samples, methods, parameters, and clean up the file to improve the quality of the import. You can even create a whole database, sites, stations, valid value lists, etc. from one or more import files. You can also run your own custom queries at any stage of the import process, making the import of difficult data files much easier.
Multiple Inputs & Outputs
Capabilities include a lab and field data interface, data validation, a user-friendly selection screen, and integrated graphing, mapping and reporting. It has been accepted by numerous industrial companies, government agencies, and consulting companies. The Enviro Data user interface runs within Microsoft Access, and because it is open source, the software can be easily customized for specific project needs. Enviro Data is the only program of its kind that works equally well storing the data in Access, SQL Server, or Oracle, and we have numerous users on each of these platforms. We have an excellent relationship with most of the major laboratories to facilitate transferring data into Enviro Data efficiently and accurately. We also have a strong interface from Enviro Data into ArcGIS, and have a companion product called Enviro Spase that helps you efficiently display your data on GIS maps

Industrial Strength Database Design
This powerful and intuitive software uses Microsoft Access as a front-end user interface and Access, SQL Server or Oracle as a back-end database server. This open system, based on industry standard software, allows the system to be easily modified, by you or by Geotech, for specific project requirements. The data storage structure (data model) has been carefully refined over many years based on our experience storing millions of records of site data, and satisfies the rules of Fifth Normal Form data structure.
Software-assisted Data Validation
Let Enviro Data do the heavy lifting for your data validation tasks. Automatically review and flag data for holding times, spike recoveries, valid detection limits, QC frequencies, and much more. The software does the calculations, then presents the results for the validator to make the final determination of suitability for use. Enviro Data goes beyond file-by-file automated data review with historical outlier analysis, charge balance calculations, and more. And you can track the review status of every result in the database.

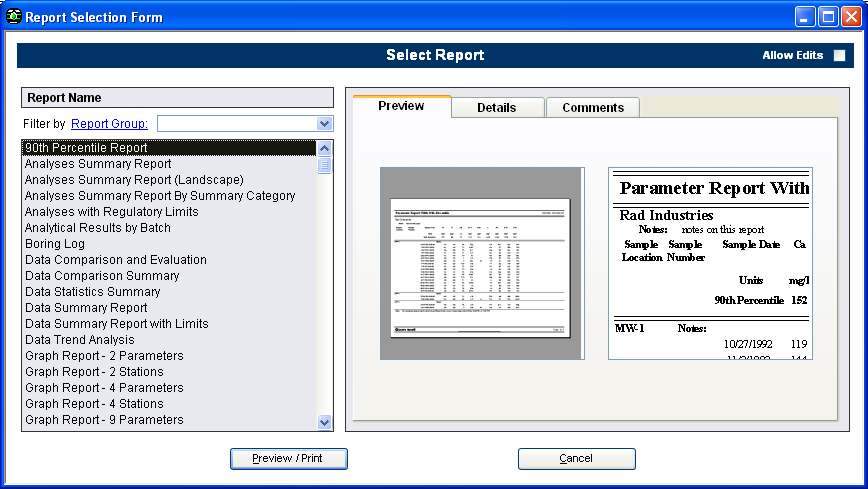
Many Sophisticated Report Formats
The program comes with several dozen pre-configured reports that will satisfy many of your needs. Format your results exactly as you wish, with special handling of flagged data, non-detects, dilutions, and trailing zeros. Save your selections for later use. Change the standard reports and queries, or add your own. Do it your way! Other powerful Enviro Data features include tracking of quality control and review status of all the data, and also support for data validation. Believe it or not, Enviro Data can even overcome Access's problem with displaying the right number of decimal places where there are trailing zeros. (This is something that Excel can't easily do either.) You can even define parameters for each station, and include those lines whether they were analyzed or not.
Lookup or Valid Value Tables
Enviro Data has an extensive set of over 80 tables where you can store your lookup (or valid) values). The list of lookups for parameter names, flags, units, and so on, will often change from project to project. Enviro Data gives you complete control of these lookup tables, and you can customize them to suit the needs of each of your projects.
You can also set up libraries of lookups that can be shared between databases and with your laboratory. This is very useful if you have several projects with the same lists, such as Air Force ERPIMS or Army ERIS projects, or multiple projects in one state with the same maximum concentration levels.


Create Your Own Reports
A very strong feature of Enviro Data is its user-configurable custom reporting. For that project with special requirements, it's easy to modify an existing report or create a new one with a specific data presentation. This is one of the many features that makes Enviro Data almost infinitely flexible; able to accommodate project needs while leveraging the power of a time-tested product.
Boring Log Lithology Display
This new feature now lets you display lithology logs showing your sample data. Choose from over 60 lithology patterns or add your own. Show depth ranges, lithology patterns and names, formation/aquifer information, detailed sample descriptions, and other data for your samples.


Graph Reports with Trend and Limits
The Viewer contains many different preformatted reports but one of the most popular are the graph reports. These reports produce 2, 4 and 9 graphs per page for either stations or parameters with the legend and comments shown on the right or bottom of the page. These are multi-page reports and can show ether the additional stations or parameters on additional pages. Enviro Data contains many different. They also have the option to display regulatory limits and/or a trend line for the graphs. The grid reports are a companion to the graphs showing a table of up to 12 samples of the formatted data with or without flag codes.
Expanded Groups Feature
This powerful new feature in Enviro Data helps you organize, retrieve, and display just the way you need to for your projects. This grouping works for stations, samples, and parameters, including parameters by different methods. You can easily create the groups using the Select Data screen. Now stations can be in multiple groups. This feature also lets you deal with thorny issues like parameters in different groups resulting from analysis by different methods.


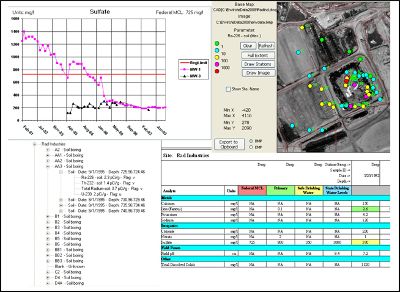
Create Maps Right In the Database*
If you don't need a full-blown GIS system, or just want an easy way to make simple maps of your data, Enviro Data has basic mapping capabilities built right into the database software. You can display your existing CAD drawing as a base map, and then select a parameter for display by date, depth, etc. The software will then let you select cutoff values, and display colored dots and the values on the map. (*Currently only available in 32-bit Office.)
Graph Your Data
Enviro Data can automatically convert your data to consistent units, find the regulatory limit that you have selected for the parameter being displayed, and draw a graph showing the data and the limit. Graphing features can be turned on and off so you can get just the display that you need for your specific project requirements.
Color-codes Stations and limits are available along with custom graph series markers and multiple user-defined scales. Many graph reports offer 2, 3, 4 or 9 graphs per page with a separate page for each station or parameter.


Powerful Crosstab Wizard Reporting Tool
For many clients the primary purpose of Enviro Data is for their data reporting. Now you can do this with the Crosstab Wizard which gives you full control over layout (for example samples across and parameters down, or vice versa), the row and column header fields, and the formatting of each specific result. You can also put different data types on different tabs, and show descriptive statistics for the data. Of course you can automatically compare to regulatory limits, up to 12 at a time. You can set up as many formats as you like, and save each one with a name for future use.
Many Export Formats
Enviro Data can export data in many useful formats. Some formats are for other popular software such as Surfer, RockWare, EVS, and Enviro Insite. Some are for agencies such as various states, the EPA (SCRIBE and WQX), Air Force (ERPIMS) and Army (SEDD, ADR and ERIS). You can also define and save output formats, just as you can with import formats. Other available formats are for printing or further processing. And Geotech's Enviro Spase product really brings the GIS link alive. Contact Geotech about your export format needs.

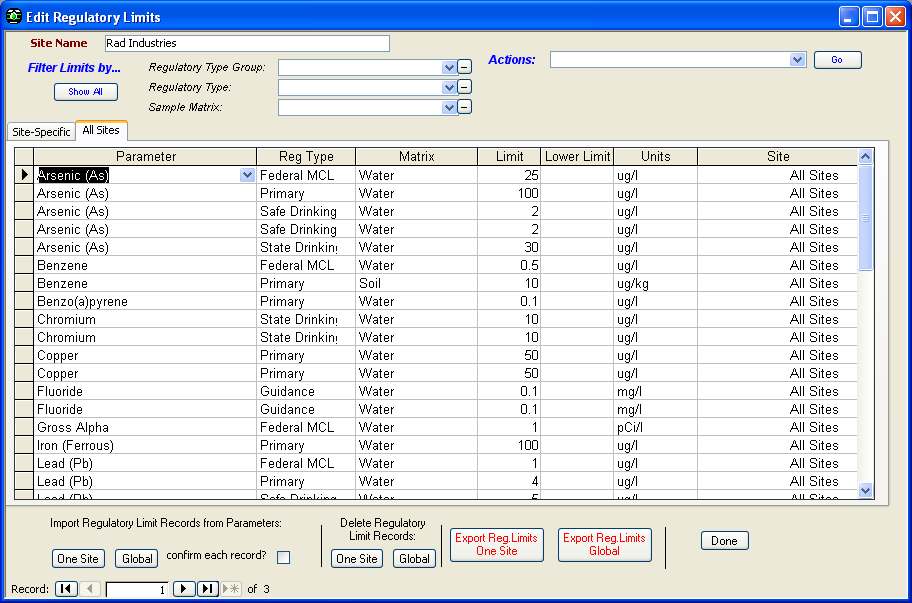
Flexible Regulatory Limits
Enviro Data can store and display multiple regulatory limits by matrix, parameter and site. The editing screen for this data is shown to the right. You can type in the limits, or import them from spreadsheets. Limit types can be displayed in various ways, such as background or foreground color, bold or italics, or superscripts and subscripts. The graphing system can display a selected limit. Some of the reports can highlight data records that exceed the limit, or show only the exceedences.
Easy to Use
The best news is that Enviro Data provides you with all of this scalable power while still being easy to use! Whether you are implementing a data management system from scratch, replacing an outdated older program, or just trying to get your data organized, you can be productive with your new system in just a few hours. Backed up by our widely praised customer support and our rapidly growing list of useful features, Enviro Data is your obvious choice for the latest in site data management software, now and for the future.
Typical Client Feedback
"Faced with managing an overwhelming and expanding amount of environmental data, we had to find a way to store, retrieve and evaluate information for regulatory compliance purposes. Geotech solved our data management problem by developing a customized system, based on their Enviro Data program, tailored to our specific needs. They provided exceptional service and always made the extra effort to explain the rationale behind their work" - VP of Planning, Major Oil Company.
Biological Data
Along with its other uses, Enviro Data has been used for many years to manage laboratory data for tissue sampling. Over the last several months Geotech has been working with Oak Ridge National Laboratory in Tennessee to expand the Enviro Data software to better handle additional types of biological data by integrating the system that they have used internally for many years, into Enviro Data, combining the best capabilities of both into a flexible, yet easy to use system. Now you can use Enviro Data to handle taxonomy, life stage, gender and tissue type as well as your chemical data. This can be used for both discrete samples or population census data. Contact Geotech for more information!
Key Features
Click here to see a summary of the key features.
Contact Us
Phone: (877) 740-1999 or (303) 740-1999
EMail: info@geotech.com
© 1995- 2023 Geotech Computer Systems, Inc.
Header photos by Dave Rich